File:strong bad smiling graph.png
From Homestar Runner Wiki

Size of this preview: 800 × 482 pixels
Full resolution (1,200 × 723 pixels, file size: 47 KB, MIME type: image/png)
[edit] Summary
Annual frequency of Strong Bad Smiling in toons from 2000 through 2009. Stacked bars indicate number of annual toon appearances, with red portions denoting toons without smiling and pink indicating toons where he smiled. The blue line indicates the overall percentage of toons that year in which a smile appeared.
Data from the December 8, 2023 revision of Strong Bad Smiling.
[edit] Licensing
| | |
File history
Click on a date/time to view the file as it appeared at that time.
(Latest | Earliest) View (newer 50) (older 50) (20 | 50 | 100 | 250 | 500)| Date/Time | Thumbnail | Dimensions | User | Comment | |
|---|---|---|---|---|---|
| current | 00:22, 13 December 2024 | | 1,200×723 (47 KB) | Bleu Ninja (Talk | contribs) | (Limit to 2000-2009 – There are so few data points from 2010 onwards (most years have less than five SB appearances) that a percentage line graph is not statistically useful and the bars become difficult to read.) |
| 00:56, 1 January 2024 | 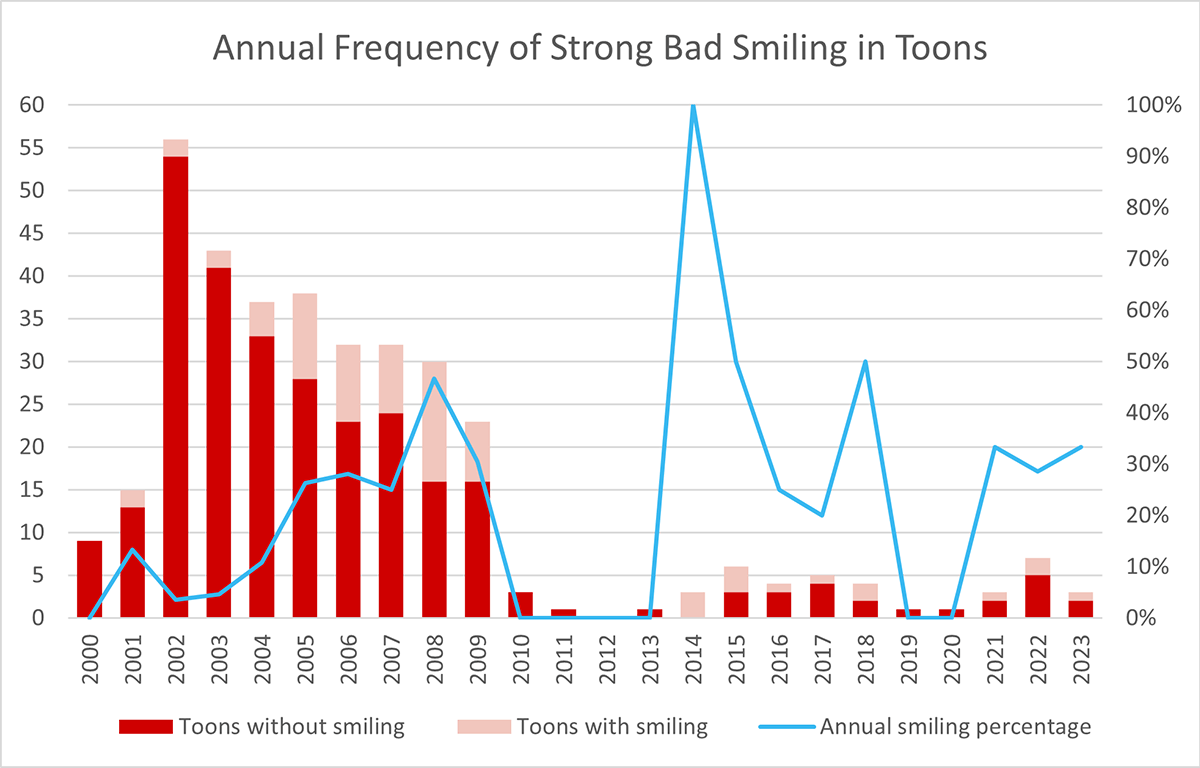 | 1,200×768 (55 KB) | Bleu Ninja (Talk | contribs) | (Annual frequency of Strong Bad Smiling in toons) |
- Edit this file using an external application (See the setup instructions for more information)
File links
The following page links to this file:
